
- Analysts emphasize the bitcoin futures funding flow index, which plunged from around 50% to 7.1%, indicating extreme bearish sentiment.
- The cryptocurrency market began February under significant pressure, with Bitcoin testing trader confidence after a January sell-off.
- This decline suggests that the market is likely in a capitulation phase or a pause before further decline, with critical indicators showing strong selling pressure.
- The index measures the balance between long and short positions in futures contracts, using funding rates and price movements to identify market sentiment.
The cryptocurrency market entered February under heavy pressure, with Bitcoin once again testing traders’ conviction after a sharp sell-off at the end of January. While price charts alone already hinted at weakness, on-chain and derivatives-based indicators have added more depth to the picture. One metric in particular has captured the attention of analysts and institutional observers alike: the bitcoin futures funding flow index. On February 2, well-known on-chain analyst Axel Adler Jr. highlighted a sudden and dramatic move in this indicator, sparking renewed debate about whether the market is approaching a classic capitulation phase or merely pausing before further downside. According to data shared by BlockBeats, the index collapsed from around 50% to just 7.1% in a matter of days—an extreme move by historical standards. This development comes at a time when Bitcoin is already struggling to regain bullish momentum after falling below key psychological price levels. Taken together with rising volatility, skewed funding rates, and elevated leverage stress, the data suggests that the market remains firmly in a bearish structure, at least for now.
Understanding the Bitcoin Futures Funding Flow Index
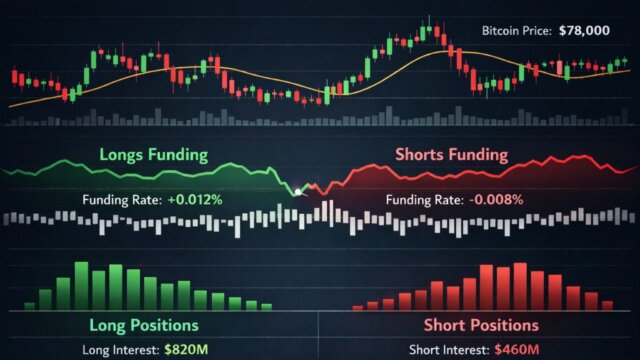
Before diving deeper into what the latest readings mean, it’s important to understand what the bitcoin futures funding flow index actually measures and why traders rely on it. At its core, the index combines Bitcoin price movements with funding data from futures markets. Funding rates reflect the balance between long and short positions in perpetual futures contracts. When funding is positive, long traders pay shorts, indicating bullish sentiment. When funding turns negative, shorts pay longs, signaling bearish positioning.
What makes this index unique is that it doesn’t look at funding rates in isolation. Instead, it blends them with price trends to capture how capital flows are behaving relative to market direction. This helps analysts identify moments when leverage, sentiment, and price action align—either in optimism or in fear. Historically, extreme lows in the index have often coincided with periods of intense selling pressure, where traders rush to de-risk and close positions. These moments can mark either the deepest point of a downtrend or the beginning of prolonged bearish consolidation.
A Sudden Collapse to Extreme Levels
According to Axel Adler Jr., the index began falling rapidly last Friday, breaking down from relatively neutral territory near 50%. By February 2, it had reached 7.1%, placing it near the bottom of its historical range for the past month. Such a low reading is not just statistically rare—it is psychologically significant. It implies that futures market participants are heavily skewed toward defensive positioning, with funding flows suggesting overwhelming bearish sentiment. Price action supports this interpretation. Since January 28, Bitcoin has followed a clearly defined downward trend, failing to establish higher highs or reclaim key resistance zones. More importantly, since January 30, the index has remained below the critical 45% threshold, which this model uses as the dividing line between neutral and bear market territory. As long as the indicator stays below that level, the broader trend remains bearish, regardless of short-term price bounces.
What a 7.1% Reading Has Meant in Past Cycles
In previous market cycles, a reading near 7% on the bitcoin futures funding flow index has frequently appeared close to moments of market capitulation. Capitulation occurs when selling pressure reaches an emotional peak, forcing weak hands out of the market. During these phases, traders often experience:
- Rapid liquidations of leveraged positions
- Sharp spikes in volatility
- One-sided funding rates reflecting panic positioning
- Temporary breakdowns below key support levels
While capitulation can eventually set the stage for a recovery, it does not guarantee an immediate trend reversal. In fact, markets can remain volatile and directionless for weeks after such events as liquidity is absorbed and confidence slowly rebuilds. For a genuine shift in market structure, Adler notes that the index must climb back above 45%. Additionally, price behavior must stabilize, with reduced volatility and more orderly trading ranges. Until those conditions are met, any upward movement is best viewed as a corrective rally, not the start of a new bull market.
Short-Term Bounces Are Not Trend Changes
One of the most common mistakes traders make during bear markets is mistaking relief rallies for trend reversals. The current structure, supported by derivatives data, suggests caution. Even if Bitcoin experiences a sharp bounce from oversold conditions, the underlying funding flows tell a different story. Without sustained improvement in leverage balance and funding neutrality, bullish momentum lacks a solid foundation. This is why analysts emphasize patience. A true trend change typically unfolds in stages:
- Capitulation and forced selling
- Stabilization and reduced volatility
- Gradual return of balanced funding
- Higher lows forming on the price chart
At present, the market appears to be hovering between the first and second stages.
The Bitcoin Local Stress Index Adds Another Layer
Alongside funding flow data, analysts are also closely watching another metric: the Bitcoin Local Stress Index (LSI). This tool aggregates multiple stress factors, including volatility, funding rates, and leverage levels, into a single signal designed to capture overall market pressure. When Bitcoin’s price dropped below $78,000 on the night of January 31, the LSI reacted sharply, spiking to 92.5. That level pushed the index into what analysts describe as a “tail risk alert” zone—a state where multiple risk factors converge simultaneously. Over the following weekend, the LSI remained elevated, indicating that stress had not yet dissipated. As of the latest reading, the index stands at 73, still well within the high-risk range.
How Stress Levels Have Behaved Historically
Looking back at historical data, LSI readings above 90 often align with short-term price bottoms. These moments typically occur when selling pressure begins to lose momentum, even if prices remain weak. However, there is an important caveat. If the LSI drops below 80 while new stressors continue to emerge—such as rising volatility or worsening funding imbalances—the signal shifts. In that scenario, the market becomes vulnerable to a waterfall-style decline, where prices fall rapidly with little resistance. This is why analysts are watching the interaction between stress levels and funding flows so closely. Neither metric should be interpreted in isolation.
The sharp decline in the bitcoin futures funding flow index, combined with persistently high readings in the Bitcoin Local Stress Index, sends a clear and sobering message: the market is still navigating a bear-phase environment marked by fear, leverage unwinding, and liquidity stress. While extreme readings often precede stabilization or even recovery, history shows that patience is critical. Until funding flows normalize and price action confirms a structural shift, any rebounds should be treated as temporary corrections rather than definitive trend reversals. For now, Bitcoin appears to be in the difficult but necessary process of absorbing shock—a phase that has historically laid the foundation for the next major move.
Disclaimer: CryptopianNews shares this for learning and info only. It’s not meant to be financial or investment advice. Crypto markets change a lot and move quickly. Investing in them can be risky. You should always look into things yourself. Talk to a trained financial advisor before making any choices about investing.
- Bitcoin Futures Funding Flow Index Shows Capitulation - February 2, 2026
- AI Boom Leaves U.S. Software Stocks Behind - January 31, 2026
- What Is DeSoc Crypto & Why Vitalik Cares - January 28, 2026