

- Bitcoin has recorded its highest weekly close in five weeks, signaling renewed market strength despite weakness in traditional markets.
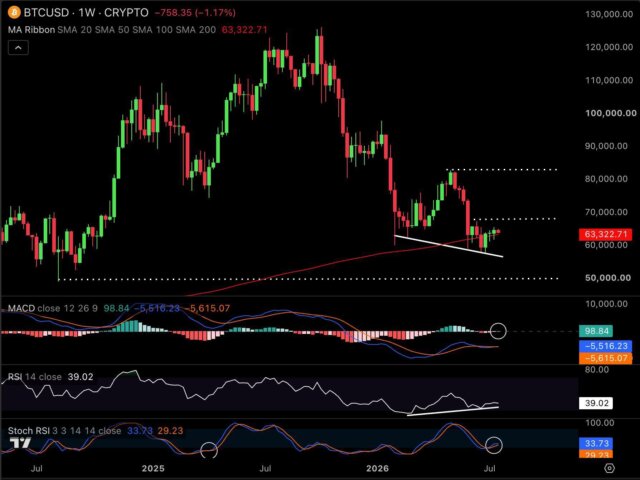
- Technical indicators, including the MACD, RSI, and Stochastic RSI, are pointing toward improving bullish momentum.
- The $58,000 support level remains the key price to watch, while $67,000 and $83,000 are the next major resistance zones.
The recent Bitcoin highest weekly close has caught the attention of traders and investors as the cryptocurrency continues to show resilience. While the Nasdaq 100 dropped more than 4%, Bitcoin managed to stay above its 200-week moving average (MA) for the third consecutive week. This performance highlights growing confidence among buyers and suggests that long-term market sentiment remains positive. Moreover, several technical indicators are now flashing bullish signals, making the coming weeks especially important for Bitcoin’s price direction.
Bitcoin highest weekly close Signals Strong Market Momentum
Bitcoin’s latest weekly candle closed at its highest level in five weeks, reinforcing the importance of the 200-week moving average as long-term support. Holding above this level for three straight weeks is often viewed as a sign that buyers are maintaining control. As a result, many analysts believe the broader uptrend remains intact despite recent market volatility. In addition, Bitcoin’s strength stands out because it occurred while technology stocks experienced significant selling pressure. This divergence suggests that digital assets are attracting investors looking for alternatives during periods of uncertainty. Consequently, Bitcoin continues to demonstrate its ability to perform independently of traditional financial markets.
Technical indicators also support this optimistic outlook. The Moving Average Convergence Divergence (MACD) has turned bullish, indicating increasing buying momentum. Meanwhile, the Relative Strength Index (RSI) continues to display a bullish divergence, a pattern that often appears before upward price movements. Furthermore, the Stochastic RSI is showing positive momentum, strengthening the case for continued gains.
Technical Levels Every Trader Should Watch
Price levels remain critical for determining Bitcoin’s next major move. Currently, the strongest support sits near $58,000, which has become the most important level for bulls to defend. If buyers successfully hold this zone, confidence could continue building across the market. Above the current price, $67,000 represents the first significant resistance. A successful breakout above this level could open the path toward $83,000, which stands as the next major target. Therefore, traders will closely monitor price action around these resistance zones in the coming weeks.
Another encouraging sign comes from the bullish engulfing candle that formed three weeks ago. Interestingly, this pattern has appeared only three times during the current market cycle. Each previous occurrence was followed by a strong upward rally, giving investors another reason to remain optimistic. Nevertheless, confirmation through sustained buying volume will still be important.
Possible Scenarios for the Weeks Ahead
The market now faces two realistic scenarios. First, if Bitcoin highest weekly close continues to be supported by strong buying above $58,000, momentum could gradually push prices toward $67,000. After that, traders may begin targeting the higher resistance around $83,000. Additionally, improving technical indicators could encourage more institutional and retail participation. On the other hand, investors should also prepare for downside risks. If Bitcoin closes below $58,000 on the weekly chart, market sentiment could weaken considerably. In that case, the next major support level is expected around $49,000, where buyers may attempt to stabilize the market.
Even so, the overall technical picture currently favors the bulls. The combination of a bullish MACD crossover, valid RSI divergence, improving Stochastic RSI, and continued support above the 200-week moving average creates a constructive outlook. However, disciplined risk management remains essential because cryptocurrency markets can change direction quickly.
In conclusion, the Bitcoin highest weekly close reinforces the cryptocurrency’s growing resilience during a period of broader market weakness. As long as Bitcoin remains above the critical $58,000 support, the probability of testing higher resistance levels increases. Investors should continue watching technical indicators and key price zones closely, as they will likely determine Bitcoin’s next major trend.
Disclaimer: CryptopianNews shares this for learning and info only. It’s not meant to be financial or investment advice. Crypto markets change a lot and move quickly. Investing in them can be risky. You should always look into things yourself. Talk to a trained financial advisor before making any choices about investing.
