

- Current Bitcoin Rainbow Chart Position trading near the lower bands historically signals undervaluation and potential for significant upside.
- Historical cycles show consistent patterns, pointing to a possible major peak around 2029.
- Current price levels offer an attractive risk-to-reward zone for long-term investors.
The crypto market is once again drawing attention as Bitcoin enters a critical phase. Right now, price action sits near the lower band of the bitcoin rainbow chart, a model that has historically helped investors understand long-term market cycles. This area often signals undervaluation, which naturally attracts buyers looking for strong entry points. However, this doesn’t guarantee the exact bottom is already in. Markets rarely move in straight lines, and short-term volatility can still push prices lower. Even so, the current structure offers a compelling setup for those thinking beyond quick trades and focusing on long-term gains.
Understanding the bitcoin rainbow chart and current positioning
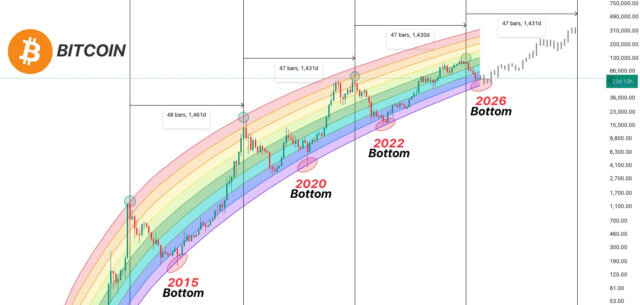
The bitcoin rainbow chart is a long-term valuation tool that maps Bitcoin’s price across colored bands. Each band reflects a different stage of market sentiment, ranging from “fire sale” zones to “maximum bubble territory.” Over multiple cycles, this model has shown surprising consistency. At present, Bitcoin is trading close to the lower bands. This zone historically represents accumulation phases, where smart money slowly enters the market. While price has already touched this region once, it doesn’t rule out another dip before a confirmed bottom forms. Importantly, these lower levels often provide the best risk-to-reward opportunities. Even if prices drop slightly further, the downside remains limited compared to the potential upside seen in previous cycles. That’s why many investors view this range as a strategic entry zone rather than a reason to panic.
Price expectations and key support zones ahead
Looking forward, there is still a realistic chance that Bitcoin could dip below the $60,000 mark. Based on current projections, a likely bottom could form between $59,000 and $53,000. In a more precise scenario, a perfect bottom might appear around $53,700. That said, markets don’t always follow models perfectly. Sometimes, prices reverse before reaching the lowest predicted levels. Therefore, waiting for a “perfect” entry can lead to missed opportunities. Instead, many traders prefer scaling in gradually as price approaches key support zones. As long as the broader structure holds, this range remains significant. However, a clear breakdown below the entire lower band would challenge the model’s validity. Until then, the current setup continues to reflect a healthy correction within a larger bullish cycle.
Long-term cycle outlook and future price potential
When analyzing Bitcoin’s history, one pattern stands out clearly. The time between major market tops has consistently been around 1,430 days. If this rhythm continues, the next major peak could occur around September 2029. This long-term perspective shifts the focus from short-term fear to future potential. Even a move toward the mid-range of the rainbow chart could push Bitcoin well beyond its previous all-time high. In that scenario, prices between $140,000 and $170,000 become realistic targets. On the higher end, reaching the upper bands could drive Bitcoin into the $270,000 to $370,000 range. While these numbers may seem ambitious, they align with past cycle behavior. As a result, the current market phase offers a unique opportunity to position early before the next major expansion.
Conclusion
In summary, the bitcoin rainbow chart continues to provide valuable insights into Bitcoin’s long-term trajectory. While short-term dips remain possible, the current lower-range positioning presents a strong risk-to-reward setup for patient investors. Historical patterns suggest that accumulation during these phases often leads to significant gains over time. As long as the macro structure remains intact, this period could mark the foundation for the next major bull cycle.
Disclaimer: CryptopianNews shares this for learning and info only. It’s not meant to be financial or investment advice. Crypto markets change a lot and move quickly. Investing in them can be risky. You should always look into things yourself. Talk to a trained financial advisor before making any choices about investing.
- BTC stuck in a range: Large Buyers Signal Strength - July 20, 2026
- CLARITY Act Odds Drop to 35% After DOJ Warning - July 18, 2026
- Strategy Updates Financial Policy for Bitcoin Holdings - July 2, 2026