

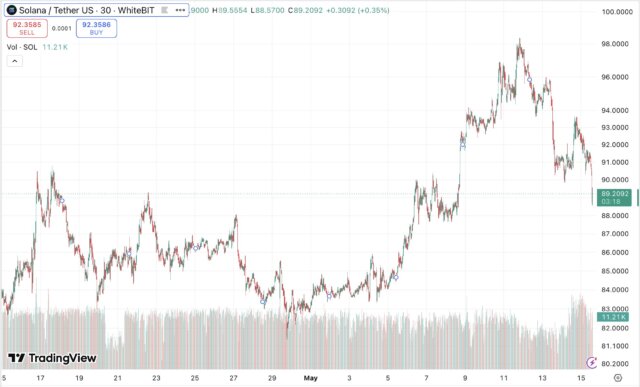
- Solana continues to trade inside a long-standing price channel between $88 and $98.
- Buyers are actively defending the $88 pivot, while resistance near $98 remains strong.
- A confirmed breakout above $98 could open the door toward $107 and $117 targets.
The crypto market remains highly reactive to technical levels, and Solana is currently sitting at one of its most important zones. Traders are closely watching whether buyers can maintain momentum after the recent rejection at the $98 resistance level. Although price briefly slipped toward $91, bulls quickly stepped in to defend support. At the moment, the broader market structure still favors consolidation rather than a full trend reversal. As long as SOL holds above the $88 pivot, the bullish channel that has been active since February remains valid. This setup keeps investors focused on the next potential breakout opportunity.
Solana chart analysis Shows Strong Support Near $88
The current market structure highlights how important the $88 level has become for traders. Over the past several weeks, SOL has repeatedly respected this area as a mid-range pivot inside the broader daily channel. Because of this, many short-term investors now see it as the key level separating bullish momentum from deeper downside risk. On the 4-hour timeframe, SOL recently bounced from the 50% Fibonacci retracement level near $90.25. This reaction suggests buyers are still defending the trend despite recent selling pressure. In addition, trading volume has remained relatively stable, which often signals that investors are waiting for confirmation before opening larger positions. Technically, the market remains in consolidation mode. However, consolidation inside an established uptrend can sometimes lead to stronger breakout moves later. Therefore, traders continue monitoring price action carefully as SOL moves between support and resistance zones.
Resistance at $98 Continues to Limit Bullish Momentum
Even though buyers defended support successfully, the $98 resistance level remains a major obstacle. Every recent attempt to break above this ceiling has faced heavy selling pressure. As a result, SOL continues to trade within a narrow range instead of entering a sustained rally. If bulls manage to secure a strong daily close above $98, market sentiment could shift quickly. Analysts believe that such a move would likely trigger renewed buying interest across the market. Consequently, the next upside targets would sit around $107 and later near $117. On the other hand, failure to break resistance may extend the current sideways movement. Since traders are waiting for clearer direction, volatility could remain limited in the short term. Nevertheless, the repeated tests of resistance show that buyers are still actively challenging sellers.
What Happens if Solana Loses the Channel Structure?
The biggest downside risk for SOL remains a breakdown below the $88 support zone. If sellers gain control beneath this level, the broader channel structure could weaken significantly. In that scenario, price may revisit the lower channel boundary near $78. Despite this risk, current price action still favors patience rather than panic. Buyers continue defending critical levels, while sellers have not yet forced a confirmed breakdown. Therefore, the market remains balanced between bullish continuation and temporary correction. For now, investors appear to be adopting a cautious approach. The next decisive move will likely depend on whether SOL can finally overcome the $98 ceiling or lose the strength of the $88 pivot. Until then, traders should expect continued consolidation and short-term uncertainty.
In conclusion, Solana chart analysis suggests that SOL remains trapped inside a critical trading range. While buyers continue defending support around $88, resistance near $98 still blocks a stronger rally. A breakout above resistance could ignite bullish momentum toward higher targets, whereas losing support may expose the asset to deeper declines. For now, patience remains essential as the market waits for confirmation of its next major move.
Disclaimer: CryptopianNews shares this for learning and info only. It’s not meant to be financial or investment advice. Crypto markets change a lot and move quickly. Investing in them can be risky. You should always look into things yourself. Talk to a trained financial advisor before making any choices about investing.
- Stock Market Open Could Decide Bitcoin’s Next Move - July 2, 2026
- Corporate Race Heats Up as Strive Adds $50M Bitcoin - June 23, 2026
- Real World Asset Tokenization Is Reshaping Finance - June 20, 2026