

Key Bullet Points
- A $20 billion liquidation suggests short-term stress but may trigger accumulation zones.
- Onchain signals such as net flows, HODLer behavior, stablecoin metrics point to cautious optimism.
- If BTC holds key support zones, upside targets near $125K–$130K become plausible.
- But a break below structural levels could drag bitcoin toward $100K–$110K in extreme scenarios.
- Real-time data from recent reports reinforces that institutional demand still underpins the rally.
Bitcoin Price Prediction After $20 Billion Liquidation” could not be more timely. A sudden liquidation of this magnitude typically shakes confidence, triggers forced selling, and forces traders to reassess risk. Yet in crypto markets, these stress events sometimes lead to oversold conditions and fresh entry points. In this post, I dig into btc onchain metrics explained, examine bitcoin price forecast using blockchain data, and outline plausible scenarios for BTC’s next move.
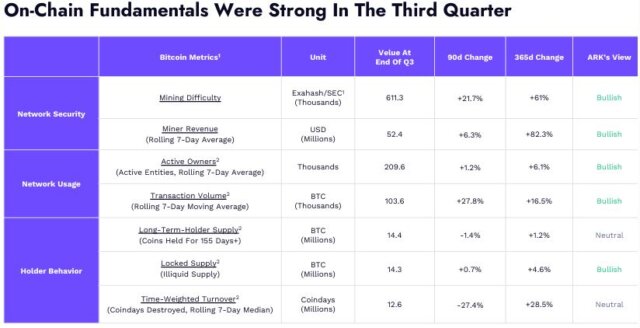
Recent data indicates Bitcoin is consolidating near ~$111,700 after a 16 % correction from recent highs. Meanwhile, ARK Invest suggests that the underlying onchain fundamentals remain resilient, and institutional involvement deepens. Let’s explore what the chain data reveals.
Context — What Does a $20B Liquidation Imply?
A liquidation of $20 billion in derivative positions often results from cascading stop-loss triggers, pushing BTC downward swiftly. That kind of move can trap weak hands. Nevertheless, markets often respond by triggering capitulation before a rebound.
- Leverage is forced out, which reduces immediate blowback risk.
- Short-term volatility spikes, but long-term accumulation can resume.
- Historically, such episodes act as volatility catalysts, not ultimate trend reversals.
Thus, the liquidation creates a reset environment — one where strong hands can accumulate. Transitioning from panic to consolidation is critical for BTC’s next leg.
Onchain Signals That Matter
Understanding which onchain metrics matter most helps decode investor sentiment. Here are several key signals:
Exchange Net Flows & Supply Drain
When exchange reserves decline, it indicates that holders are withdrawing BTC to cold storage, reducing liquidity available to sellers. Recent reports show exchange balances at multi-year lows, suggesting a supply squeeze may be forming.
Realized Profits & Whales’ Profit Taking
CryptoQuant data reveals that realized profits over the past 30 days dropped to ~0.26 million BTC, roughly half of July’s levels. Whales remain largely inactive, refusing to take profits even as BTC approached new highs. This underscores strong conviction from long-term holders.
Stablecoin Supply Ratio (SSR) & SSR RSI
SSR RSI has dipped to “buy” territory, signaling elevated buying power from liquidity in stablecoins. A low SSR means the amount of stablecoin capital relative to BTC is high — giving fuel for further accumulation.
Long-Term Holder Accumulation
Onchain data shows long-term investors have added 298,000 BTC to their portfolios.That accumulation suggests they anticipate a bull continuation, not a crash.
Supply Distribution & Institutional Holdings
ARK reports that over 12 % of BTC supply now resides with institutional entities. Their low tendency to sell and preference for regulated exposure supports price stability at current levels.
Together, these metrics point to a structure where downward pressure may be limited, and upside potential remains intact — if price supports hold.
Scenario Analysis & Price Forecast
Using bitcoin price forecast using blockchain data, we can frame plausible paths forward:
Bullish Scenario – Recovery Toward $125K–$130K
If BTC can defend key support levels (around $108K–$112K), the path may clear toward $125,000 or $130,000. Momentum could accelerate if ETF or institutional inflows resume. Technical consolidation between $115K and $125K is a likely mid-term zone. In this scenario, the liquidation becomes a reset rather than a reversal.
Base Case – Range Bound Between $112K and $122K
With mixed sentiment after the liquidation, BTC might oscillate sideways as buyers and sellers balance. In that case, expect a trading range between $112,000 and $122,000, until clear triggers push it out. Many forecasts in industry media anticipate this internal consolidation.
Bearish Case – Breakdown to $100K–$110K
If price fails to hold structural support — particularly if further liquidations are triggered — BTC risks retracing toward $100,000 or even deeper. A breakdown below $108K could provoke panic selling, pushing BTC toward $95K in an extreme scenario.
While that is less likely given current onchain strength, it remains a tail risk to monitor.
What to Watch & Key Triggers
To gauge which scenario is most likely, monitor:
- Exchange Flows & Supply — continued withdrawal strengthens the bullish base.
- Realized Profit Trends — if profit taking ramps, it signals short-term fatigue.
- SSR RSI Behavior — a rebound suggests renewed buying liquidity.
- Institutional / ETF Flows — large capital movements can swamp technicals.
- Support / Resistance Breaks — key zones at ~$108K (support) and ~$125K (resistance) matter.
Also, macro factors like rate policy, geopolitical risk, or regulation can override chain data, so remain alert.
Final Thoughts
In summary, Bitcoin Price Prediction After $20 Billion Liquidation is not a straightforward bearish call. Rather, the liquidation likely serves as a shakeout, expelling speculative excess. Based on btc onchain metrics explained, the chain data reveals sustained accumulation, cautious whale behavior, and increasing institutional supply allocation. Those dynamics support a cautiously bullish outlook.
Assuming BTC holds its critical supports, a move toward $125K–$130K is plausible. A failure to hold opens the door for deeper downside toward $100K–$110K, but that scenario seems less probable given current onchain strength.
Thus, the bitcoin price forecast using blockchain data leans toward consolidation and gradual upside rather than outright collapse. Keep a close watch on flows, profit metrics, and breakout triggers to confirm which path BTC will take next.
Read Also: Crypto Inflows Hit $6B: Unpacking the Record Surge
Disclaimer!! The information provided by CryptopianNews is for educational and informational purposes only. It should not be considered financial or investment advice. Cryptocurrency markets are highly volatile and speculative, and investing in them carries inherent risks. Readers are advised to conduct their own research and consult with a qualified financial advisor before making any investment decisions.

- Why Stablecoins Are a Growing Threat to Traditional Bank Deposits - January 28, 2026
- Rich Dad Poor Dad Author’s Bitcoin Loss: Capital Rotation Strategy Gone Wrong - January 25, 2026
- What is Corposlop in Crypto: Vitalik Buterin’s Warning About Centralized Crypto Platforms - January 21, 2026