
Important Bullet Points
- Bitcoin sustains bitcoin price above $94K clarity act delay, showing strength amid postponed US regulatory action.
- Why is bitcoin rallying despite regulation delay? Limited profit-taking and low exchange flows support resilience.
- Bitcoin ETF flows and price analysis 2026 show mixed yet notable institutional ETF activity shaping market sentiment.
- Retail demand remains weak even as larger players maintain positions near key resistance zones.
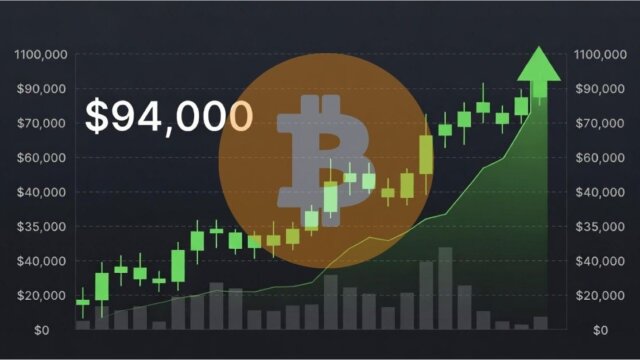
Bitcoin Price Above $94K CLARITY Act Delay: What’s Driving the Rally?
The digital asset market posted resilience after the US legislative process postponed action on the long-anticipated CLARITY Act. In recent sessions, the bitcoin price above $94K clarity act setbacks have not deterred traders. Instead, Bitcoin showed firm price behavior that defies expectations tied to regulatory uncertainties. This article explores why is bitcoin rallying despite regulation delay and reviews bitcoin ETF flows and price analysis 2026 as part of current market dynamics.
Regulatory Delay and Market Reaction
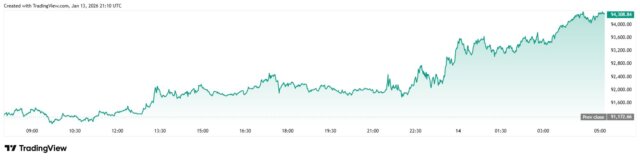
Lawmakers recently pushed back sessions on the CLARITY Act until later in January, citing unresolved topics such as stablecoin incentives, DeFi oversight, and agency roles. Despite these shifts in the legislative calendar, Bitcoin’s price action remained strong at key levels. Data shows Bitcoin briefly dipped to around $91,000 before rising above $93,500 in active trading, indicating traders did not rush to exit positions amid regulatory ambiguity.
Typically, delays in regulatory clarity can trigger volatility or downward pressure as investors reassess risk. In this instance, the market’s stability suggests a deeper acceptance that regulatory frameworks are long-term developments rather than immediate price catalysts.
Calm Net Flows and Holder Behavior
One of the most notable factors behind the recent resilience is the behavior of holders and exchange net flows. Exchange net flows remained relatively low, suggesting traders were not lifting sell orders to capitalize on short-term news. At the same time, on-chain metrics such as the Spent Output Profit Ratio (SOPR) stayed near levels that indicate limited profit-taking. This implies that many holders preferred to maintain positions rather than reduce exposure in reaction to the delayed Act sessions.
When markets have low exchange flows during supposed stress events, it often tells analysts that the risk of a sell-off is reduced. Such steadiness can foster further accumulation by long-term holders, which in turn supports price floors around key levels like $93,000–$94,000.
Institutional Demand and ETF Dynamics
A second driver can be found in institutional vehicles like Bitcoin exchange-traded funds. While activity in these products varies by day, recent flow data has shown intermittent capital entering certain spot Bitcoin ETF products. Institutional interest may be one reason prices sustain above key resistance despite mixed sentiment among retail traders.
ETF Flows and Price Indicators
Institutional money has continued to eye Bitcoin via structured products with significant inflows recorded on select days. Analysts often highlight that ETF demand can serve as a proxy for institutional engagement. Even though some products faced net outflows in prior weeks, the average realized price for Bitcoin ETFs remains materially higher than last year’s levels, suggesting that many institutional allocations are still underwater yet holding.
This pattern could be contributing to observed price support around $94K. When institutional capital remains engaged, it may counterbalance moments of weak retail activity. The result is a market that appears range-bound but resilient.
Retail Participation and Liquidity Considerations
Despite positive structures at higher levels, retail demand for Bitcoin has been softer than in past bull runs. On-chain data suggests the 30-day demand from smaller buyers remains negative, reinforcing a narrative of limited retail participation in the current rally. In many bull markets, rising retail participation amplifies price momentum as more participants chase new highs; such conditions have not fully materialized this cycle.
Liquidity conditions also play a role. When liquidity is thin, smaller moves can have outsized effects on price, yet Bitcoin’s ability to hold above the $94,000 vicinity without significant sell pressure points to deeper bid strength at those levels.
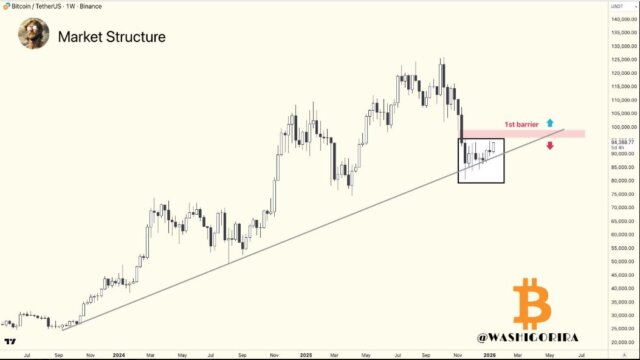
Technical Resistance and Price Structure
From a technical perspective, the $94,000 level has often acted as a key inflection point. Analysts note that sustained closes above this zone could open the door to higher resistance targets, including psychological milestones around $100,000 and beyond. Price rejection near resistance has persisted in earlier cycles, yet repeated tests can reduce overhead supply, providing an opportunity for breakout moves if supportive catalysts align.
Meanwhile, broader technical structures imply that consolidation zones can precede volatility expansions. A breakout above key resistances often attracts momentum traders, while failure to reclaim these levels may see price retrace to established support bands.
Broader Market Sentiment and Macro Context
Looking beyond pure on-chain and ETF data, broader macroeconomic and sentiment trends also impact Bitcoin’s price behavior. Fed policy expectations, inflation data, and risk appetite among global investors contribute to how capital allocators treat crypto assets relative to traditional markets. When macro indicators favor risk assets, allocations toward Bitcoin and other digital assets often strengthen.
Simultaneously, regulatory narratives such as the CLARITY Act may shift from being perceived as binary catalysts to being regarded as incremental steps toward long-term integration of cryptocurrencies into mainstream finance. This change in perception can reduce knee-jerk reactions to legislative delays and recast them as transitional milestones.
The persistence of the Bitcoin price above $94K despite the CLARITY Act delay reflects a complex mix of technical resilience, institutional engagement, muted profit-taking, and evolving market psychology. These factors combined continue to shape trader strategies and broader sentiment as Bitcoin navigates key resistance zones and prepares for potential price discovery phases ahead.
Read Also: Will Bitcoin Reach $53 Million? VanEck’s Long-Term Bitcoin Prediction Analysis
Disclaimer!! The information provided by CryptopianNews is for educational and informational purposes only. It should not be considered financial or investment advice. Cryptocurrency markets are highly volatile and speculative, and investing in them carries inherent risks. Readers are advised to conduct their own research and consult with a qualified financial advisor before making any investment decisions.

- Brian Armstrong Says Bitcoin May Have Found Bottom - June 17, 2026
- Ethereum breakout: ETH Reclaims $1,800 as Volume Explodes - June 16, 2026
- AI Crypto: How Coinbase AI Agents Automate Trading - June 14, 2026