

- Bitcoin technical analysis confirms growing bullish momentum.
- Technical indicators like MACD and Bollinger Bands suggest rising momentum.
- Strong on-chain data highlights accumulation and reduced selling pressure.
- Key resistance and support levels will determine the next big move.
- A confirmed breakout above $79K–$80K could shift the entire market trend.
Bitcoin is once again catching attention as momentum begins to shift upward. After a period of heavy correction, traders are now closely watching signals that hint at a possible trend reversal. This bitcoin technical analysis highlights key indicators, price action, and on-chain data that suggest the market may be preparing for its next move. While caution is still important, the current setup shows signs of strength that cannot be ignored.
MACD Flip Signals Momentum Reversal
One of the strongest early indicators in any bitcoin technical analysis is the Moving Average Convergence Divergence (MACD). Recently, Bitcoin’s daily MACD flipped bullish. This happens when the DIF line crosses above the DEA line. As a result, it often signals that bearish momentum is fading and buyers are stepping back in. Additionally, the histogram has turned green. This change is important because it shows increasing buying pressure. In past market cycles, similar setups marked the beginning of upward trends. Therefore, traders often view this as a reliable early signal rather than a late confirmation. However, it’s important to stay cautious. While MACD is powerful, it works best when combined with other indicators. Even so, the current shift suggests that momentum is building again after a healthy correction phase.
Lower Timeframes Show Strong Bullish Structure
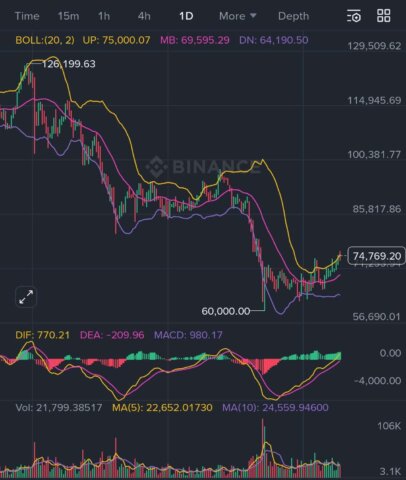
On the 4-hour chart, the picture becomes even clearer. Price action is showing strength as Bitcoin pushes toward the $76K level. At the same time, it is riding the upper Bollinger Band. This usually indicates strong buying pressure and continued upward momentum. Moreover, the Bollinger Bands are expanding. This expansion often signals that volatility is increasing in the direction of the trend. In this case, the trend is clearly upward. As a result, traders may expect continued movement rather than immediate consolidation. The MACD on this timeframe also supports the bullish outlook. The DIF remains above the DEA, and both lines are trending upward. Meanwhile, the histogram continues to grow in green. All these signals combined suggest that, at least in the short term, bulls are in control.
On-Chain Data Confirms Market Strength
Beyond charts, on-chain data provides deeper insight into market behavior. A solid bitcoin technical analysis always considers these metrics because they reflect real investor actions. Currently, over 400,000 BTC has been accumulated between $60K and $72K. This creates a strong support base under the market. At the same time, long-term holders are selling less. This is a key sign of confidence. When experienced investors hold onto their coins, it often means they expect higher prices in the future. Additionally, miner capitulation has slowed down, reducing selling pressure from mining operations. Another important factor is the Relative Strength Index (RSI). It is currently around 53, which is neutral. This means the market is not overbought yet. Therefore, there is still room for further upside without immediate risk of a sharp correction.
Key Resistance and Support Levels to Watch
Understanding key price levels is essential in any bitcoin technical analysis. These levels act as decision points where price may reverse or break out. Right now, several resistance zones are in focus. The first major resistance is around $76K, which is the recent high. Just below that, $75K aligns with the daily Bollinger Band resistance. Another important level is $74.4K, which has historical significance. If Bitcoin breaks above these levels, it could open the door for further gains. On the downside, support levels are equally important. The first support sits at $72.8K, which has held in recent price action. Below that, the $69K–$71K zone represents a major liquidity area. Finally, $60K acts as a strong structural floor. This level has seen heavy accumulation and could provide long-term support if tested again.
The $79K–$80K Level: A True Trend Shift?
While current signals are encouraging, the real test lies ahead. The most critical level to watch is the $79K–$80K range. According to this bitcoin technical analysis, a weekly close above this zone would change the entire market structure. If Bitcoin successfully reclaims this level, it would confirm a full bullish trend. This could attract more buyers and push the market into a new phase of growth. However, until that happens, the current move should be seen as a strong bounce rather than a confirmed bull run. Therefore, traders should remain patient. Watching how price reacts near resistance levels will be key. At the same time, managing risk is essential, especially in a volatile market like crypto. Bitcoin is showing promising signs of recovery, but confirmation is still needed. The combination of technical indicators and on-chain data paints a positive picture. However, the market must break key resistance levels to fully validate this momentum shift.
In conclusion, this bitcoin technical analysis suggests that momentum is returning after a healthy reset. Indicators like MACD, Bollinger Bands, and RSI support a bullish outlook. Additionally, strong accumulation and reduced selling pressure add confidence to the setup. Still, the $79K–$80K level remains the ultimate trigger for a full trend reversal. Until then, traders should stay alert and prepared for both scenarios.
Disclaimer: CryptopianNews shares this for learning and info only. It’s not meant to be financial or investment advice. Crypto markets change a lot and move quickly. Investing in them can be risky. You should always look into things yourself. Talk to a trained financial advisor before making any choices about investing.

- Bitcoin tightest session: Why Traders Are Watching $65K - July 20, 2026
- Can 5x Bitcoin Still Happen This Market Cycle? - July 18, 2026
- Capital Is Chasing AI: Why Bitcoin Is Waiting Its Turn - July 2, 2026