
Important Takeaways
- Bitcoin slipping below $67,000 places price inside a historically sensitive accumulation zone
- Previous cycle lows formed after similar percentage drawdowns and sentiment collapses
- On-chain metrics suggest long-term holders are reducing sell pressure
- Bitcoin price cycles and bottoms often develop slowly, not through sharp reversals
Bitcoin Below $67K and Market Psychology Shift
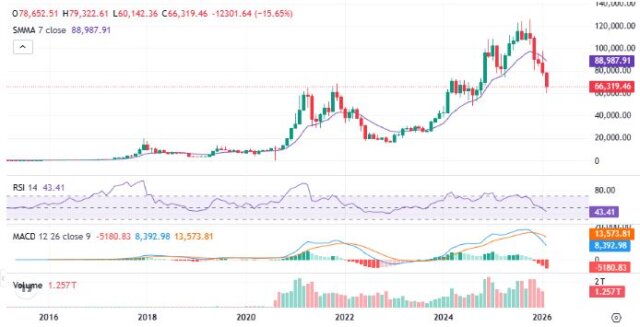
Bitcoin trading below $67,000 has changed market sentiment noticeably, as optimism gave way to caution across digital asset markets. While short-term traders focus on volatility, long-term participants increasingly analyze structure, data, and historical context.
The bitcoin below 67k bottom formation narrative is not based on price alone. Instead, it reflects how markets behave when leverage unwinds and emotional selling peaks. Historically, Bitcoin does not bottom when confidence is high. Rather, bottoms emerge when fear dominates headlines and patience thins.
Currently, derivatives funding rates have cooled, spot volume has stabilized, and forced liquidations have slowed. These shifts often signal that aggressive selling pressure is losing momentum. Moreover, Bitcoin’s dominance remains elevated, suggesting capital is rotating defensively rather than exiting crypto entirely.
Importantly, price remaining below major psychological levels tends to compress volatility over time. This compression frequently precedes structural bottoms, especially when macro conditions stop deteriorating further.
Bitcoin Historical Bottom Patterns Across Major Cycles
BTC historical bottom patterns reveal consistent behavioral similarities across multiple market cycles. Although external conditions change, investor psychology remains remarkably predictable.
What History Repeatedly Shows
- Cycle lows typically form after 65%–80% retracements from peak values
- Bottoms develop over weeks or months, not single trading sessions
- Price stabilizes before narratives turn positive again
During the 2018 and 2022 bear markets, Bitcoin spent extended periods below prior support levels. At the time, confidence was low, yet those zones later proved to be generational entry points.
Another key observation is volume behavior. At historical bottoms, selling volume declines even while price remains weak. This divergence often indicates that sellers are exhausted, allowing accumulation to begin quietly.
Bitcoin historical bottom patterns also show that news flow is usually negative during formation phases. Regulatory pressure, macro tightening, or industry stress tends to peak near cycle lows, not at tops.
Bitcoin Price Cycles and Bottoms in a Post-ETF Market
Bitcoin price cycles and bottoms are evolving due to institutional participation, yet core cycle mechanics remain intact. Spot Bitcoin ETFs have introduced deeper liquidity and longer investment horizons, which can smooth extreme volatility.
Structural Differences This Cycle
- Institutional holders tend to accumulate gradually rather than chase momentum
- ETF inflows and outflows influence short-term price, but not long-term supply scarcity
- Long-term holder realized profits remain historically low during downturns
Despite these changes, Bitcoin still moves through expansion and contraction phases. Price peaks attract speculative leverage, while downturns flush excess risk from the system. Bottoms form once leverage resets and long-term holders regain control.
On-chain data currently shows reduced exchange inflows, meaning fewer coins are being sent to sell. At the same time, older wallets are largely inactive, which historically aligns with bottoming behavior rather than distribution phases.
While timing exact lows is impossible, understanding bitcoin price cycles and bottoms helps investors contextualize volatility instead of reacting emotionally.
Data Signals Supporting a Potential Bottom Formation
Several data-driven indicators now align with conditions observed near prior market lows. While no single metric guarantees a bottom, confluence increases probability.
Key Supporting Signals
- Long-term holder supply remains near cycle highs
- Realized losses have slowed despite continued price weakness
- Market sentiment indexes remain in fear territory
Why This Matters
Bottoms form when selling pressure diminishes, not when buying suddenly spikes. Current conditions reflect stabilization rather than euphoria, which historically favors base-building rather than continuation declines.
External macro pressure, including interest-rate expectations and liquidity conditions, also appears less aggressive than earlier in the cycle. Although uncertainty remains, markets often bottom when conditions stop worsening, not when they improve.
Read Also: Bloomberg Bitcoin Analyst: BTC’s True Value Still Ignored
Disclaimer!! CryptopianNews provides this information for educational and informational purposes only. You should not consider it financial or investment advice. Cryptocurrency markets are highly volatile and speculative, and they carry inherent risks. We advise readers to conduct their own research and to consult with a qualified financial advisor before making any investment decisions.

- Polygon Leads as Visa Expands Stablecoin Network for Cross-Border Payments - April 29, 2026
- Michael Saylor Quantum Computing Bitcoin Threat: Is Bitcoin Ready? - April 24, 2026
- Iran Crypto Toll Plan for Oil Tankers in Strait of Hormuz - April 12, 2026