

- Ethereum resistance near $2,400 is being tested as price consolidates with strong bullish momentum and rising trading volume.
- Technical indicators like MACD and Supertrend suggest growing bullish momentum.
- Strong ETF inflows and declining exchange reserves support a supply squeeze narrative.
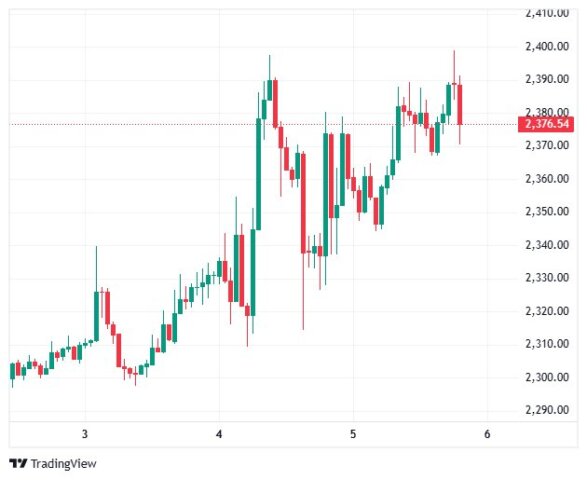
Ethereum is entering a crucial phase as it challenges a key level that traders are closely watching. The ethereum resistance near $2,400 has become the center of attention, especially as price action tightens and indicators begin to align. Recently, Ethereum rebounded toward $2,393 and is now stabilizing near $2,370, which shows buyers are still active. At the same time, multiple signals point toward a possible breakout. Technical indicators are turning bullish, while on-chain data suggests reduced selling pressure. Because of this, the coming days could define Ethereum’s next major move. Let’s break it down step by step.
Technical Indicators Signal Growing Strength Around ethereum resistance
Ethereum’s chart is starting to look more optimistic. The daily MACD indicator is close to confirming a bullish crossover, which often signals the beginning of upward momentum. In addition, the Supertrend indicator has stayed positive since mid-March, showing that the broader trend is still intact. Moreover, price action is holding above key support levels despite repeated tests of resistance. This suggests that buyers are absorbing selling pressure. As a result, the market is building a base just below the resistance zone, which is often seen before a breakout. Another important factor is market structure. Higher lows are forming, which indicates steady accumulation. Therefore, if Ethereum manages to break above this level with strong volume, it could trigger a faster move upward.
Fibonacci Levels and Price Targets to Watch
From a Fibonacci retracement perspective, Ethereum is currently trading near the 61.8% level around $2,381. This level is often considered a strong support zone during an uptrend. Because price is holding above it, the bullish case remains valid. If Ethereum successfully breaks above $2,400, the next key target sits near the 38.2% retracement level around $2,772. This level could act as the next resistance zone, where traders may start taking profits. However, reaching this level would confirm a strong continuation of the trend. On the downside, failure to break resistance could lead to short-term consolidation. Even then, holding above $2,300 would keep the overall structure intact. So, while short-term pullbacks are possible, the bigger picture still leans bullish.
On-Chain Data and Institutional Demand Strengthen Outlook
Beyond technical analysis, on-chain data is adding more confidence to Ethereum’s outlook. Exchange reserves have dropped to around 14.5 million ETH, which is the lowest level since mid-2016. This means fewer coins are available for selling, reducing downward pressure. At the same time, institutional interest is picking up. Recent ETF inflows of about $101 million show that large investors are returning to the market. This kind of demand often supports long-term price growth. Additionally, lower supply combined with rising demand creates a favorable environment for price increases. Therefore, if buying pressure continues, it could push Ethereum beyond its current range. This makes the current phase especially important for both traders and investors.
Conclusion: A Defining Moment for ethereum resistance
Ethereum is clearly at a turning point. The ethereum resistance near $2,400 is not just a price level—it’s a signal of what could come next. Technical indicators, Fibonacci levels, and on-chain data are all pointing toward a possible breakout. However, confirmation is still needed. If Ethereum breaks above this level with strong volume, the next target around $2,772 becomes realistic. On the other hand, failure to break could lead to short-term consolidation before another attempt. Overall, the setup looks promising. With strong fundamentals and improving technicals, Ethereum may be preparing for its next major move. Traders should watch this level closely, as it could shape the market direction in the weeks ahead.
Disclaimer: CryptopianNews shares this for learning and info only. It’s not meant to be financial or investment advice. Crypto markets change a lot and move quickly. Investing in them can be risky. You should always look into things yourself. Talk to a trained financial advisor before making any choices about investing.

- Swell 2026 Highlights Growing XRP Institutional Momentum - June 20, 2026
- Brian Armstrong Says Bitcoin May Have Found Bottom - June 17, 2026
- Ethereum breakout: ETH Reclaims $1,800 as Volume Explodes - June 16, 2026